Cloud Eye (CES)
Take advantage of our consulting services!
Our experts will be happy to help you.
Hotline: 24 hours a day, seven days a week
Cloud Eye (CES)
Cloud environments also need functions that grant users an overview of their resources (monitoring). Which resources are active, which have been stopped, and what is their level of utilization? The monitoring function measures all of a user’s resources and displays them in the form of lists or graphics. Configurable alarm functions, which help users manage solutions, are another important feature.
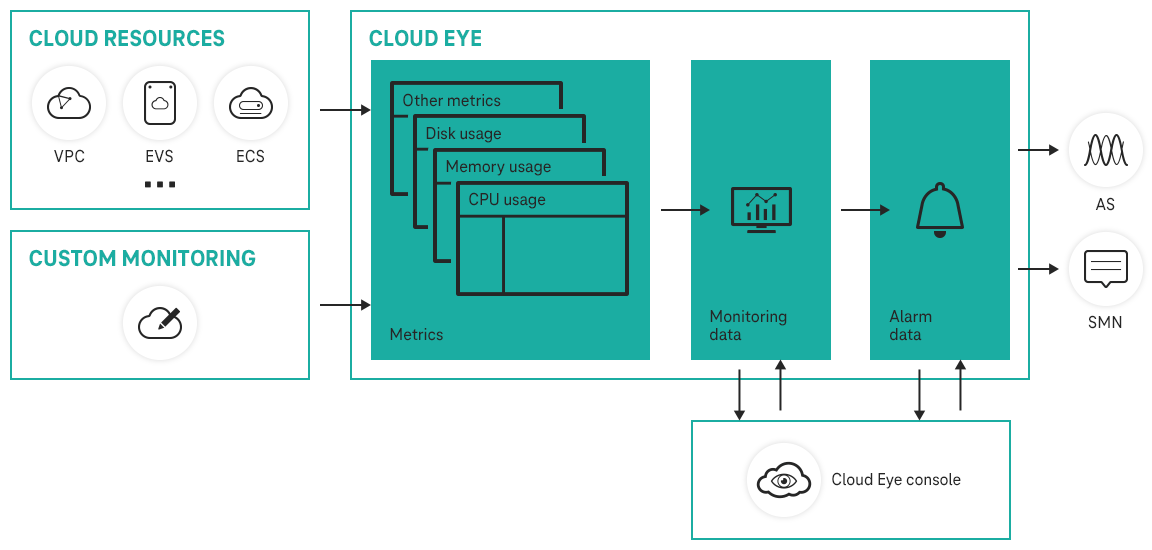
Cloud Eye (CES) is a high-performance monitoring service with integrated alarm functions. Open Telekom Cloud users benefit from a dashboard with a basic overview of resources and their current status. Users can configure the alarm function in such a way that they receive notifications via SMS or email. Monitoring with the Cloud Eye Service is activated by default; the free service does not need to be booked or activated. For financial reporting, the Open Telekom Cloud also offers a free Financial Dashboard for all direct users in addition to Cloud Eye.


This service does not need to be booked or activated - monitoring starts automatically after you have enabled cloud services and created resources such as Elastic Cloud Servers (ECSs).

Custom alarm templates are available in addition to the default templates tailored to each service. When the custom conditions are met, notifications enable you to quickly respond to resource changes.

Cloud Eye sends alarm notifications to subscriptions in real time by invoking the Simple Message Notification (SMN) API.

The Cloud Eye panel allows for the real-time monitoring of cloud services using graphs and panels. It enables you to view cross-service and cross-dimension monitoring data, and displays key metrics, providing an overview of the service status and monitoring details that you can use for troubleshooting.

If a service volume increases, Cloud Eye sends you an alarm notification, enabling you to manually expand the capacity or configure Auto Scaling to automatically increase capacity.

If Cloud Eye does not provide the required metrics, you can use custom monitoring and report the collected monitoring data. Cloud Eye helps to display those data in graphs and allows you to create alarm rules for those custom metrics.

When the metric data reaches the threshold specified in an alarm rule, Cloud Eye notifies you by email or text message, allowing you to keep track of the statuses of cloud services. Cloud Eye can also send HTTP/HTTPS messages to an IP address of your choice, enabling you to build smart alarm handling programs.

Alarm templates allow you to create alarm rules in batches for multiple cloud services.

You can use the data dump function to query metrics on the DMS for Kafka console or on an open-source Kafka client. It helps you dump cloud service monitoring data to Kafka in real time.
The following services are interconnected with Cloud Eye:
Service | Namespace | Reference |
SYS.ECS | ||
SERVICE.BMS | ||
SYS.AS | ||
Elastic Volume Service (EVS) | SYS.EVS | |
SYS.EFS | ||
SYS.SFS | ||
SYS.ELB | ||
SYS.NAT | ||
Elastic IP and bandwidth | SYS.VPC | |
SYS.WAF | ||
SYS.DMS | ||
SYS.DCS | ||
SYS.DDS | ||
SYS.RDS | ||
SYS.DWS | ||
SYS.ES |


* Voucher can be redeemed until December 31, 2024. Please contact us when using the voucher for booking. The discount is only valid for customers with a billing address in Germany and expires two months after conclusion of the contract. The credit is deducted according to the valid list prices as per the service description. Payment of the credit in cash is excluded.